
Devops Research and Assessment (DORA) Metrics
Measure the four key metrics that indicate the performance of a software development team, based on the established DORA research.
Research Background
The intention of the metrics developed by the DORA research group was to establish a benchmark to measure velocity and stability across companies.
Baselining our organization’s performance on these metrics is a great way to improve the efficiency and effectiveness of our operations.
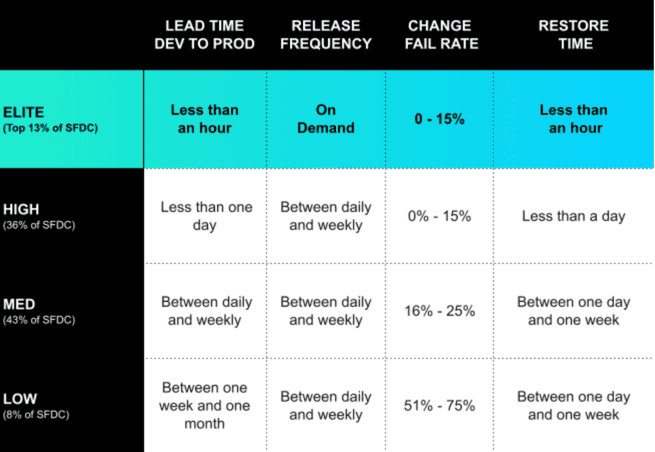
The research group established the following benchmark for measuring "Elite" performance in software delivery:
The 4 Key Metrics
The following is a comparison between Google's definition of the metrics, versus how they have been implemented in Gitlab. Keep in mind that not all the metrics are available yet. The current status of the supported metrics is tracked in a Gitlab Epic upstream.
| Metric | Google's Definition | Gitlab's Definition |
|---|---|---|
| Deployment Frequency | How often an organization successfully releases to production | Average deployment frequency to production, based on the deployments end time |
| Lead Time for Changes | The amount of time it takes a commit to get into production | Median time between a merge request being merged and deployed to the production environment |
| Change Failure Rate | The percentage of deployments causing a failure in production | tbd |
| Time to Restore Service | How long it takes an organization to recover from a failure in production | tbd |
There are also additional metrics provided by Gitlab, which can be taken into consideration as well:
- pipeline durations
- mean time to merge for MRs
- code coverage
- ... see the Analytics section of a Gitlab project or group
Gathering Key Metric Data
How to get started with measuring our performance? The journey starts with gathering data.
Fortunately Gitlab can do the heavy lifting here, so gathering the data is as simple as defining a production
environment in your deployment job.
In a projects .gitlab-ci.yml:
deploy-prod:tags:- eks-eu-central-1-platform-prodenvironment:name: production
Gitlab also supports recording metrics for additional environments, or environments not following the pre-defined names via deployment tiers.
To link for example your environment prod to the production deployment tier, you can specify the following:
deploy-prod:tags:- eks-eu-central-1-platform-prodenvironment:name: proddeployment_tier: production
From now on Deployment Frequency and Lead Time for Changes will get measured.
Visualizing Metrics and Gaining Insights
Currently the available metrics can be seen on Gitlabs project or group level under the Analytics > CI/CD section.
- https://gitlab.carloop.dev/groups/YOUR_GROUP/-/analytics/ci_cd?tab=deployment-frequency
- https://gitlab.carloop.dev/YOUR_GROUP/YOUR_PROJECT/-/pipelines/charts?chart=deployment-frequency
You can also take a look at this Example Project and Example Group.
Additionally, we started to ingest the metrics for all projects to elasticsearch, so we can compare them between groups as well. The metrics (WIP) can be seen in the Shared Kibana Dashboard.
Continous Improvement
Gathering and Visualizing the metrics is of course only a first step.
We currently see this as a conversation starter, to spark ideas of how development teams can improve their devops metrics. This can be done by exchanging ideas in the architecture guild, creating lightning talks, setting up knowledge sharing between teams or starting some discussions with your dedicated somebody.
Further follow-ups will be evaluated in the architecture guild. If you are interested, feel free to join us in Architecture Guild.